Overview
The Structure Activity Landscape Index (SALI) is a numerical approach to quantifying
activity cliffs [
1] and is described
in
Guha and Van Drie (2008a).
The paper describes an approach to visualize the activity cliffs in
a SAR dataset in the form of a network (or graph) termed the SALI network.
The original approach was based on static images generated using
Graphviz.
This visualization tool allows one to interactively explore a SALI
network at different cutoff values, allowing one to focus on more or
less significant activity cliffs. In addition the application now
generates SALI curves (
Guha and Van Drie, (2008b)),
which allows
one to characterize the ability of a modeling protocol to capture
the SAR landscape.
It is a modified version of the ZGRViewer
application that visualizes networks described in the DOT language.
The application has been tested on OS X, Linux and Windows Vista,
though it should work anywhere where Java runs and Graphviz
has been installed.
Show Recent Updates
Update (07/24/09) - 2.0 uploaded which now supports loading structures from
SD files. In such a case, the SD file must have a property representing the activity.
Currently, Type 2 curves are not supported when reading from SD files.
Update (06/02/09) - 1.9 uploaded which updates the version of zvtm. Properly handles
SVG from recent versions of graphviz
Update (02/13/09) - 1.8.3 uploaded which properly renders aromatic rings
Update (02/12/09) - 1.8.2 uploaded with improved rendering and slightly faster
fingerprints
Update (02/02/09) - 1.8.1 uploaded and the single jar file is much smaller than
recent versions as it does not include the entire CDK
Update (01/26/09) - 1.8 uploaded and now brings back substructure highlighting. Also
atoms are no longer colored, which makes it easier to see the highlighted substructure
Update (01/17/09) - 1.7 uploaded and includes improvements to fingerprint calculation
performance and the latest 2D rendering code
Update (01/16/09) - Moved source code to GitHub repository, located at
http://github.com/rajarshi/saliviewer/tree/master
Update (09/27/08) - Fixed a bug where the SALI curve UI was not synced with the
chemical data that may have been freshly loaded. This update makes sure that when new
chemical data is loaded, the SALI curve UI is killed.
Another result of this update is that the jar file is 15MB. This is because we now include the entire
CDK library. This is done because the latest version does not properly display 2D depictions on
OS X. After this is fixed we will provide a leaner update.
Update (05/13/08) - Updated to use dashed edges between nodes that have a similarity of 1.0
Update (05/08/08) - Updated so that the SALI zoom slider indicates the cutoff
at which the network gets so large that layout and rendering might take a long time.
Currently, a large network is defined as having 200 or more edges. The cutoff is rounded
up to the nearest 10, so it's an approximate indicator
Update (05/06/08) - Fixed a bug which resulted in fingerprint calculation failing
since the config file did not have the fingerprint type attribute in it. Also added a dialog to indicate that data loading is complete. Probably should make
this into a message on the status bar
Update (04/26/08) - Fixed rendering issues with the latest CDK trunk. Also provided
the option to choose which CDK fingerprinter the network should use
Update (04/25/08) - SALI curve functionality is now included
in the application. The input format has also been extended to allow
specification of one or more predicted property columns
Update (02/29/08) - Depictions of pairs of molecules are now resizable. The application also
uses the graph directory specified in the Preferences window. Activities are formatted to two
decimal places. Keyboard shortcuts added for loading SALI data and generating the SALI matrix. Also
provide a menu option to toggle whether structure differences are highlighted
Update (02/17/08) - Depictions of individual molecules are now resizable
Update (02/16/08) - Structure depictions now display molecule name and activity in the
panel itself, rather than just on the title bar. Updated preference pane for SALI operations. You can now alter the
length and depth of the CDK fingerprint, highlight differences in the structure for a SALI
pair (though for large molecules, MCSS detection may take a very long time) and also define
whether a smaller activity value is better (say IC50) or a larger one is better (say -log IC50)
Update (02/15/08) - Updated code to handle molecule names starting with
a digit or names containing dashes. The input file format has been changed
and the code updated to support it. No longer crashes if activity is missing.
Edges corresponding to cliffs for which the similarity equals 1.0, have diamond
shaped arrow heads. All other edge will have the normal triangular arrow head.
Update (01/23/08) - Structural differences between pairs are not highlighted due
to a bug in the CDK MCSS detection procedure. Once that's fixed, it'll be back
Update (01/22/08) - The program will now highlight the difference in the two structures
when an edge is clicked. Note that this seems to be buggy as the MCSS algorithm is sometimes behaving
weirdly. Also, edges of the graph are now colored based on the magnitude of the activity cliff, at a
given cutoff value. Black
is the largest cliff and light grey is the smallest cliff.
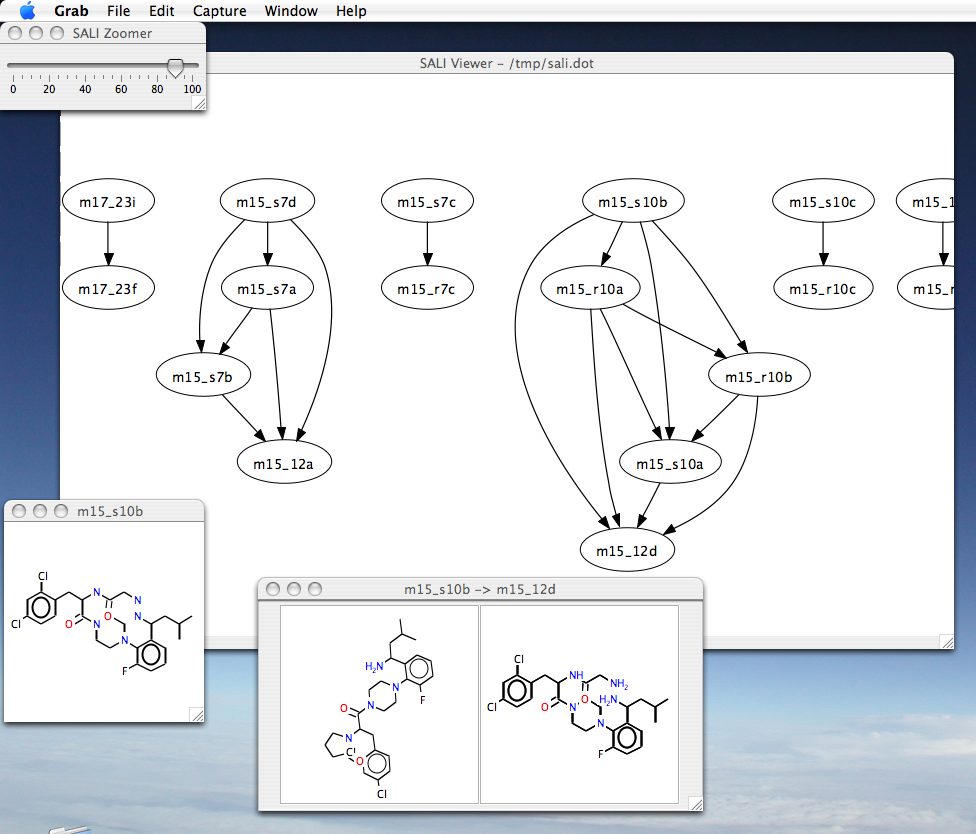
Visualizing SALI networks
An example of the interface is
here. There are
three ways to visualize SALI networks.
- On the fly networks: In this approach all you need is the data file
(format) which is used to generate the SALI matrix.
The application utilizes the CDK hashed fingerprints to evaluate the SALI
matrix and it should be noted that this fingerprint is not as discriminative
as something like the BCI fingerprints. Once the SALI matrix has been
generated you can explore the structure at various SALI cutoff levels on
the fly.
- Pre-calculated networks: In this approach, you use an external
program to generate the DOT file describing the network. One way would
be to use the R functions to generate it. The resultant DOT file and
a data file (format described here containing the
molecule names, SMILES and activities can then
be used to visualize the network. By definition this approach restricts
you to looking at a single network - you cannot generate a new network
with a different SALI cutoff value.
- Loading a SALI matrix: Not implemented yet
In all cases, the edges of the SALI network are colored in a grey scale,
such that black represents the most significant activity cliff and light grey corresponds to the
smallest activity cliff,
for a given cutoff
Download
You can get the v2.0 SALI viewer (based on ZGRViewer v0.8) from
here and a few example SALI networks are provided
below. You'll need to have
Graphviz installed on your system
for the viewer to work.
You can also get the v2.0 tarball or
zip of the sources.
Untar the sources and then run ant sali to generate the SALI viewer
jar file.
The development version of the soure code is available from
GitHub and is
licensed under the LGPL.
Usage
If you're running SALIViewer for the first time, you must go to the Preferences window
and specify the paths to the various Graphviz executables. If you don't do this you will get
an error when you try to generate the SALI graphs
In general, once you have loaded or generated a network you can use the following
key/mouse combinations to explore the network
- Browse around the network (Alt+Click+Drag allows you to select a
region which is focused on)
- The overview mode (View->Overview) is a handy way to navigate
around a large network
- Alt+Click on a node brings up the structure for the node
- Alt+Click on an arrow brings up the structures for the head and
tail of the edge
Precalculated networks: If you have a precalculated network (see the dot files
here) along with
the data file you can view the network using the following steps
- Start up the viewer (on Unix it should be java -jar
sali.jar). You'll need to set some paths in the Preferences
window the first time you run the program.
- Navigate to File->Open->Open with dot->SVG
pipeline and select one of the dot files below
- Navigate to SALI->Load Chemical Data and select the
a data file (such as mc4r.dat)
Networks on the fly: If you want to generate networks on the fly (using the CDK fingerprint),
- Navigate to SALI->Load Chemical Data and select the
a data file
- Navigate to SALI->Generate SALI matrix
This will bring up the SALI network at a 90% cutoff level. You will also see a slider which
allows you to change the cutoff (between 0 and 100). Note that very low cutoffs will generate
very large graphs and will take time to process. Useful values of the
cutoff are between 25% and 90%
SALI curves:
Generation of SALI curves requires that you have generated the SALI
matrix as described above. Also, you should have at least one column
of predicted values that will be used in the SALI curve
calculation. If these conditions are satisfied the following steps
will generate SALI curves:
- Navigate to SALI>Generate SALI curves
- In the popup window, double click on one of the columns
representing the predicted values. At this point, these columns will
be labeled as Value 1, Value 2 etc.
- Click on the Plot SALI curves button
- Switch to the Type 1 tab or the Type 2 tab to view the SALI
curves
You can try it using a
PDGFR dataset. It
contains two columns of "predicted" activities - the first such column
is simply a jittered version of the actual activity values whereas the
second such column consists of uniformly distributed random numbers.
Format
The data files required by the SALI application should be in the form
SMILES molecule_name activity pred1 pred2 ...
The fields are whitespace (tab or space) separated and lines starting with
# are
ignored. Names that start with a digit will have an underscore prepended
and any dashes in names are replaced with an underscore. If you
are using DOT files generated by another application make sure the node
names match the molecule names in the data file.
Note that though the terrm activity is used, the program assumes that
smaller values of activity are better (i.e., more potent). This is the
way one would view IC50's or Ki's. If your data
is such that large numbers are more active, you should transform your
data prior to using this program or else set the appropriate option in
the settings window.
The columns labeled pred1, pred2 and so on are
optional. The should represent predicted values of the activities,
for use in SALI curve generation. Note that the values do not
necessarily have to represent predicted activities. In general they
can be any set of predictions or ranks, that are expected to
correlate with the observed activity.
Input can also be provided in SD format. In this case, molecule titles are munged
as described above. In addition the SD file must have at least one property representing
the activity value for the molecule. If multiple properties exist in the file, you will
have the option of choosing one.